How good are your Loss/Deferral Management People Processes? If you are looking to start from scratch or find out how your processes compare to Best-In-Class and what you could better, then this is where to start.
Origins
First developed in the 1990’s to Improve production efficiency for offshore North Sea assets, use of the Choke Model lead to a circa 50% reduction in production deferrals/losses, year on year for 3 years in a row on the Magnus Platform. An overall reduction of 80%+. The compelling benefits of implementing this technique lead to the operator developing choke models for all or their assets and that is where I first got involved.
The originator, “Andrew Goodwin” wrote an SPE paper on the subject:
SPE Paper 36848 Increasing Production in a Mature Basin: “The Choke Model”
Things have moved on significantly since then, principally in the development and refinement of the people processes involved in delivering maximum value from the choke model.
Benefits
This choke model approach will deliver value to the asset by systematically eliminating loss and improving the ratio of planned- to-unplanned losses and events. The outcome is increased production and extended life of field through lower lifting costs and incrementally improved capacity. The approach encourages the asset to transition to a more proactive and planned operation, reducing reactive behaviours (improving cost efficiency) and encouraging focus on root causes, monitoring and analysis (improving integrity management).
Modelling the Asset
In a Choke Model, the asset is broken down into a number of “System Sources” (e.g. Well, Well site equipment, Compressor, Mol Pump, Methanol Regeneration, Steam producer, Export Pipeline etc. etc.). These sources are organised and grouped into “Chokes” and these Chokes will vary depending on the operating environment and products. For example, Onshore vs Offshore Oil & Gas, Shale Oil/Bitument, LNG etc.
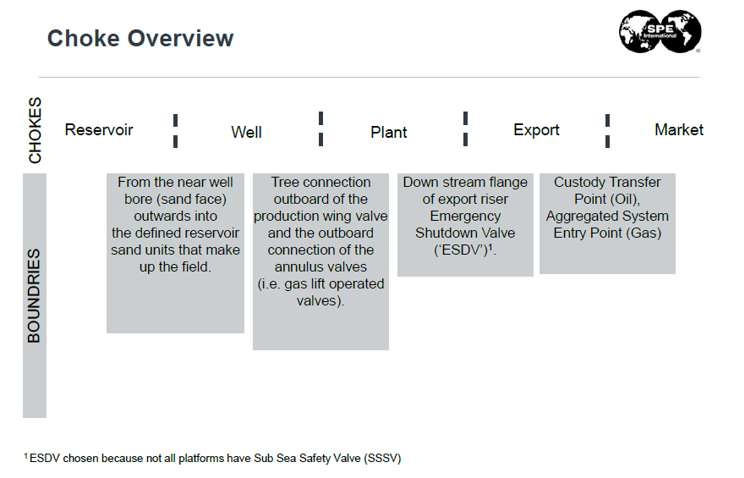
The following Choke Model represents a typical offshore Oil & Gas asset.
Chokes
- Reservoir
- Wells
- Plant
- Export
- Market/Commercial
(Click image to enlarge)
Figure 1: North Sea Example of Choke definitions agreed by the SPE Production Efficiency Steering Group
Identifying the Asset’s capacity for Improvement and Growth
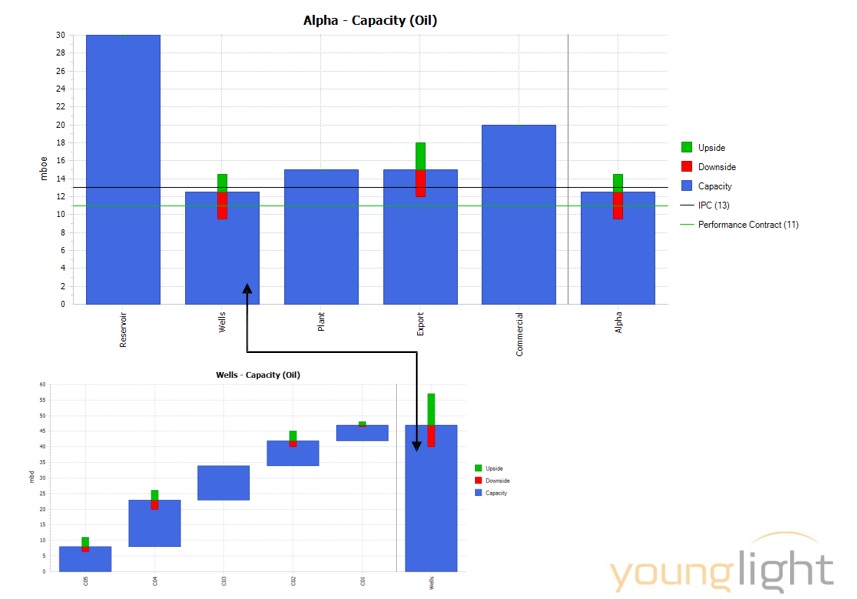
The Capacity of each choke is derived and represented (along with any uncertainties) next to the other Chokes on a chart so that an overall view of the complete supply chain is produced. This “Choke Model” then supports a number of people processes developed to improve the production efficiency throughout the whole asset.
(Click image to enlarge)
Figure 2: An example of a choke model showing the current capacity through each choke together with the uncertainties (upside & downside). The breakdown of the wells choke is illustrated here, showing how a “top level” choke model can be built from its component parts. Graphic taken from Younglight’s Choke Model software.
This chart is critical for two main processes, the Maximum Production Potential (MPP) decision making process and for logically organising opportunities in order to Grow the MPP.
The MPP itself is used on a daily basis where any gap between MPP and actual production is allocated to one or more Loss/Deferment events. Each loss/deferment event is allocated a System Source, Cause, Volume and various other pieces of information. As well as the short term identification of major production deferral/loss events, this provides a wider perspective of the issues affecting an asset where often the lower level but chronic problems will be more significant than the obvious lager scale events in terms of volume and $ value. Being able to chart the $ value of issues over a period time facilitates good decision making and provides instant business cases for targeted Operational Expenditure. Of course sometimes it may simply be changes in behaviour or just having the right conversation that brings about resolution.
“For instance Magnus realized that a large part of its avoidable losses were due to export problems and thus were able to have a meaningful discussion with downstream operators about the influences they had on Magnus production. This early success helped inspire the other assets to continue to expand the choke analysis.”
(SPE Paper 36848 Increasing Production in a Mature Basin: “The Choke Model”)
For more information or if you have any questions or queries, please don’t hesitate to contact me.
Neil Hardy
+44 (0)7767 890636
neil.hardy@younglight.com
More Coming Soon…